
Best and worst airports for 3-hour+ delays: What US travelers should expect
Which US airlines delay passengers the most (and the least)? This analysis uses AirAdvisor AirData to rank airlines by long delay rates and average delay time.
TL;DR
- Overall, Austin Bergstrom International Airport is the worst hub for significant delays.
- LD180+ is the number of flights from the airport delayed on arrival by 180+ minutes.
- The worst 3 airports for delay time, Charlotte, Austin, and George Bush Houston, can leave passengers waiting for over 6 hours on average.
- Some smaller airports had zero 180+ minute delays in 2025; these are the best performers.
- The data period is from January 1 to December 31, 2025.
Flight delays happen all the time, but when they reach the 3-hour mark, the inconvenience and disruption are extremely high. To predict the likelihood of significant delays in 2026 and beyond, we used our 2025 AirAdvisor AirData to determine which US airports have the highest (and lowest) frequency of 180+ minute delays, and which have the longest average delay times.
Methodology
Worst US airports for significant delays
Using AirAdvisor AirData from January 1, 2025, to December 31, 2025, we analyzed the significant delay rate (LD180+) and the average delay time once a flight crosses the 3-hour delay mark of the USA’s 47 airports with the most flights delayed by at least 180 minutes.
- LD180+ = Arrival delay of 180 minutes or more on flights departing from the airport.
- LD180+ rate = The percentage of 180+ minute flight delays out of the total flights.
- Average long delay time = The average delay in minutes for flights that meet the 180-minute threshold.
Higher values mean longer delays and higher chances of significant delays happening in the first place. Each of the 47 US airports was then ranked from 1 to 47, where 1 is the worst. This becomes their point value. For the overall ranking, we then applied weights:
- 70% for the LD180+ rate
- 30% for the average long delay time
From this, we now have the 10 worst airports in the US for significant flight delays. The results emphasize 180+ minute delays but also take into account the average delay time, which often has a dramatic travel impact.
Best US airports for long delays
In all, there were many US airports without any instances of LD180+. That also makes the average significant delay time zero. To come up with the top 10, we used the US airports with zero significant delays that have the highest flight volume. The more flights offered, the higher the chances of longer delays. Keeping it to zero is a much bigger feat if you have 3,000 flights vs. having only 200.
Key findings
- Severe delays are rare, but extremely disruptive. At the top 10 worst airports for long delays, the average LD180+ rate is 1.8%.
- Charlotte Douglas, Austin Bergstrom, and George Bush (Houston) all have average delays of over 6 hours, so when significant delays happen, it can be catastrophic.
- Airports with very high flight volumes, like Los Angeles, generate large numbers of severely delayed flights even when their delay rates are moderate (1.09%). Smaller percentages applied to massive traffic volumes still affect thousands of passengers.
- Airports like Southwest Florida (RSW), Norfolk (ORF), and Lambert St. Louis (STL) still appear in the top 10 despite having lower traffic volumes.
- Palm Beach International Airport has the highest 180+-minute delay rate and is also the worst airport in the USA for 60+ minute delays.
Ranking of the 10 worst US airports for 180+ minute delays
Rank | Airport | Total flights | Flights delayed | Delayed flights % | Top 3 Worst Routes | Average delay, min | Total points (weighted) |
1 | AUSTIN BERGSTROM INTERNATIONAL AIRPORT (AUS) | 56008 | 969 | 1.73 % | #1 AUS - DFW (193/6392 flights) | 369.76 | 4.8 |
2 | CHICAGO O’HARE INTERNATIONAL AIRPORT (ORD) | 386602 | 6639 | 1.72 % | #1 ORD - LHR (279/14193 flights) | 336.25 | 8.5 |
3 | JACKSONVILLE INTERNATIONAL AIRPORT (JAX) | 28746 | 557 | 1.94 % | #1 JAX - JFK (147/4998 flights) | 323.82 | 9.2 |
4 | SOUTHWEST FLORIDA INTERNATIONAL AIRPORT (RSW) | 28691 | 541 | 1.89 % | #1 RSW - BOS (101/4248 flights) | 315.5 | 10.8 |
5 | NORFOLK INTERNATIONAL AIRPORT (ORF) | 19815 | 360 | 1.82 % | #1 ORF - JFK (95/4214 flights) | 308.38 | 12.4 |
6 | PALM BEACH INTERNATIONAL AIRPORT (PBI) | 26873 | 575 | 2.14 % | #1 PBI - BOS (138/4850 flights) | 290.94 | 13 |
7 | LAMBERT ST LOUIS INTERNATIONAL AIRPORT (STL) | 36688 | 616 | 1.68 % | #1 STL - ORD (173/7785 flights) | 329.18 | 13.7 |
8 | WASHINGTON DULLES INTERNATIONAL AIRPORT (IAD) | 127649 | 2265 | 1.77 % | #1 IAD - LHR (117/8203 flights) | 301.76 | 14 |
9 | DALLAS FORT WORTH INTERNATIONAL AIRPORT (DFW) | 345614 | 5877 | 1.7 % | #1 DFW - ORD (297/11797 flights) | 324.7 | 14.5 |
10 | PHILADELPHIA INTERNATIONAL AIRPORT (PHL) | 121886 | 1965 | 1.61 % | #1 PHL - BOS (144/7541 flights) | 349.3 | 14.7 |
Ranking of the 10 best US airports for 180+ minute delays
Rank | Airport | Flights | Delayed flights | Delayed flights % | Avg delay (min) |
1 | Hilo International Airport (ITO) | 3050 | 0 | 0 | 0 |
2 | Syracuse Hancock International Airport (SYR) | 738 | 0 | 0 | 0 |
3 | Pocatello Regional Airport (PIH) | 529 | 0 | 0 | 0 |
4 | Sitka Rocky Gutierrez Airport (SIT) | 518 | 0 | 0 | 0 |
5 | Walla Walla Regional Airport (ALW) | 509 | 0 | 0 | 0 |
6 | Yakima Air Terminal/McAllister Field (YKM) | 495 | 0 | 0 | 0 |
7 | Pangborn Memorial Airport (EAT) | 489 | 0 | 0 | 0 |
8 | Fort Smith Regional Airport (FSM) | 486 | 0 | 0 | 0 |
8 | Raleigh-Durham International Airport (RDU) | 486 | 0 | 0 | 0 |
10 | Wrangell Airport (WRG) | 384 | 0 | 0 | 0 |
The 3 worst US airports for significant delays
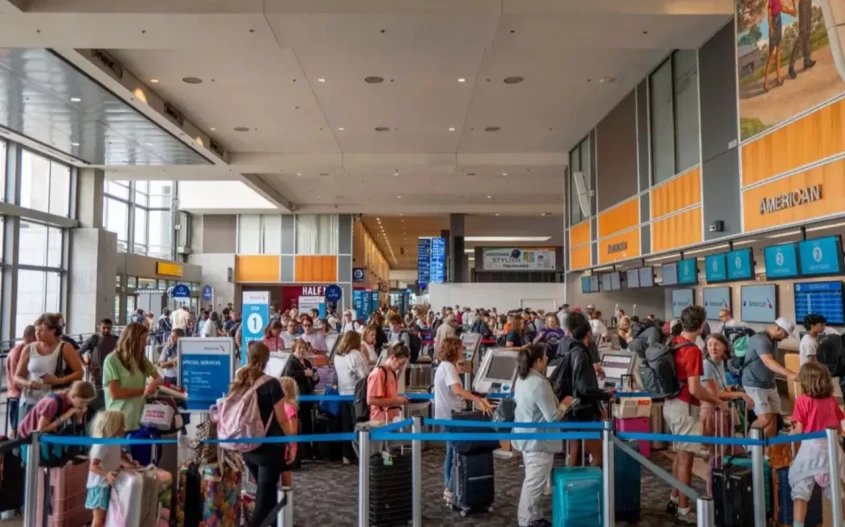
#1 Austin Bergstrom International Airport (AUS)
Austin Bergstrom Airport is definitely showing some growing pains trying to keep up with passenger demand.
Image source: us105fm.com
- The second-highest average delay time of 369.76 minutes, more than 6 hours, Charlotte Douglas Airport is the highest (370.19 minutes).
- High rate of LD180+ at 1.73%. Almost 2 out of every 100 flights departing from Austin are delayed significantly.
- The worst-delayed routes from Austin are to Dallas-Fort Worth, Chicago O’Hare, and Boston Logan.
- When you fly from Austin Bergstrom, the delays are extremely disruptive, so booking long connection times is always recommended.
.webp)
#2 Chicago O’Hare International Airport (ORD)
O’Hare’s LD180+ rate (1.72%) is only slightly lower than Austin’s, but the average delay time is a little more manageable.
- The average delay time from Chicago O’Hare is 336.25 minutes, which is more than half an hour shorter than the average 180+ minute delay at Austin.
- Tight international and domestic connections, especially on routes to London Heathrow, Dallas-Fort Worth, and New York JFK, should be avoided.
- Chicago Midway is a good alternative for domestic flights. Although it doesn’t go directly to London, it does fly to JFK and DFW.
.webp)
#3 Jacksonville International Airport (JAX)
Jacksonville is one of the lowest-volume airports in the top 10 worst, but that doesn’t mean you won’t have trouble with significant delays here.
- The LD180+ rate is about 13% higher at Jacksonville than at Austin.
- The average LD180+ delay time is the lowest in the top 3 at 323.82 minutes, a full 45 minutes less than Austin. The longest average delay time of any US airport belongs to Charlotte Douglas – 370.19 minutes (more than 6 hours).
- The most delayed routes from JAX are to New York JFK, Atlanta Hartsfield-Jackson, and Boston Logan.
- Without the flight volume of giants like Chicago O’Hare, re-routing if a significant delay happens can be trickier. Daytona Beach, which is about 100 miles away, may be a better option.
How to use this information to deal with 3-hour+ delays
When planning a trip, it’s worth checking which airports appear most often in severe delay data before you book. Airports like Austin, O’Hare, and Jacksonville are the ones to avoid due to their combination of delay frequency and average long delay time. While 3-hour-plus delays are relatively rare, they tend to last 5.5 to over 6 hours on average when they do occur.
If you have flexibility, choosing an alternative airport outside the worst 10 for 180+ minute delays can significantly reduce both your disruption risk and total waiting time. Small changes can help, too, like flying through a secondary airport or avoiding heavily congested hub-to-hub routes during peak periods. With connecting flights:
- Build in extra buffer time.
- Factor in additional time for deplaning, gate changes, customs, or transfers.
If you do encounter a long delay of three hours or more, stay proactive. Monitor your flight status closely and contact the airline as soon as a significant delay is confirmed to explore rebooking options before available seats disappear. Adjust plans early where possible to limit knock-on disruptions.
To make extended waits more manageable, many US airlines provide things like meals and accommodation when delays are within their control. And if your delay is 180 minutes or more on an international flight, you may also be eligible for flight delay compensation under EU or UK regulations, which can help offset the inconvenience.
Data Use Rights
AirAdvisor publishes AirData insights based on aggregated flight performance data analyzed for consumer information purposes. Journalists, researchers, and industry professionals are welcome to reference these findings with attribution. Please cite the source as: “Data source: AirAdvisor AirData” and include a link to the original page where the data appears. The full dataset is available upon request.
For media inquiries, data clarifications, or reuse permissions beyond citation, please contact press@airadvisor.com.
FAQs
Why is the LD180+ rate used?
If we didn’t use the LD180+ rate and instead used the raw numbers, the significant delays would appear more common than they actually are. It would also penalize high-volume airports.
How much connection time should you build into your itinerary if an airport has more frequent significant delays?
We have to stress that 180-minute delays or more are fairly rare, but when they happen, they can ruin your entire travel plan. Unless you don’t mind waiting for a connection for 6 hours or more, at least 3 hours is often enough to account for potential delays.
How often is the AirAdvisor AirData updated?
We update the AirData daily to ensure we have the most accurate information available.
Press highlights
- Severe delays are rare but extreme: On average, 1.8% of flights at our worst 10 airports are delayed 3+ hours, yet the average delay exceeds 320 minutes.
- Long delays happen both at large hubs like Chicago O’Hare and smaller airports like Jacksonville and Palm Beach.
- Austin Bergstrom Airport is the worst in the US for significant delays. Hawaii’s Hilo International Airport is the best with 0 delays of 180+ minutes in 2025.
We base our rankings on two factors. First, we calculate the rate at which arrival delays of 180 minutes or more (LD180+) occur on the airport’s departures (weight of 70%). Then, we use the average total delay time (weighted 30%). The complete data set is available upon request.
Source: AirAdvisor AirData analysis of 5,067,188 flights from January 1 to December 31, 2025, measuring LD180+ arrival delays.

Author:
Amy Lancelotte
Job/Position: Senior Writer & Content Creator
Amy Lancelotte is a Senior Content Writer and editorial contributor at AirAdvisor with more than seven years of experience producing research-driven articles for global audiences. Her work focuses on travel, aviation, and air passenger rights, with an emphasis on factual accuracy, verified data, and clear, reader-first explanations.

