


In the US, the most stressful route for nervous flyers is from New York LaGuardia to Chicago O’Hare. That’s according to the 2026 AirAdvisor Nervous Flyer Score.
We analyzed 24 major US routes, taking into account disruptions like cancellations and delays, weather exposure at the departure and destination airports, and flight time. Our final route scores don’t judge individual airline safety or turbulence.
Key takeaways
- The US route from New York’s LaGuardia Airport (LGA) to Chicago’s O’Hare Airport (ORD) is #1 on the Nervous Flyer Index, with a score of 75.8/100.
- The route with the highest cancellation rate (10.49%) is also from LGA to ORD.
- For delays, the highest rate for 60-minute+ delays is from Dallas-Fort Worth (DFW) to Orlando (MCO), and the highest for 180-minute+ delays is from Denver (DEN) to Phoenix (PHX).
- Chicago O’Hare (5 times) and Orlando International (4 times) appear the most often in the top 10 routes for nervous flyers.
- AirAdvisor’s Nervous Flyer Score measures the potential contributors to travel stress. This includes long delays, flight cancellations, weather vulnerability, and flight duration. It does not measure aircraft/airline safety or turbulence risk/severity.
The 24 most stressful domestic US routes for nervous flyers in 2026
| Route | Airports | Delayed 60+ min | Delayed 180+ min | Cancellation rate | Weather: departure (/10) | Weather: destination (/10) | Flight time (min) | Nervous Flyer Index | Rank |
New York LaGuardia – Chicago O’Hare | LGA–ORD | 11.32% | 2.48% | 10.49% | 8 | 9 | 168 | 75.8 | 1 |
Orlando – New York LaGuardia | MCO–LGA | 12.84% | 2.06% | 9.82% | 7 | 8 | 167 | 71.0 | 2 |
Boston – Chicago O’Hare | BOS–ORD | 12.71% | 2.71% | 5.16% | 8 | 9 | 202 | 65.8 | 3 |
New York JFK – Orlando | JFK–MCO | 10.54% | 2.54% | 6.85% | 8 | 7 | 172 | 63.1 | 4 |
Dallas/Fort Worth – Orlando | DFW–MCO | 14.30% | 2.39% | 3.89% | 7 | 7 | 156 | 57.1 | 5 |
Atlanta – New York LaGuardia | ATL–LGA | 10.50% | 1.67% | 6.81% | 6 | 8 | 141 | 56.9 | 6 |
Orlando – Philadelphia | MCO–PHL | 11.12% | 3.33% | 2.94% | 7 | 7 | 159 | 55.3 | 7 |
Dallas/Fort Worth – Chicago O’Hare | DFW–ORD | 11.50% | 2.25% | 3.45% | 7 | 9 | 152 | 55.2 | 8 |
Chicago O’Hare – San Francisco | ORD–SFO | 12.19% | 1.34% | 1.51% | 9 | 8 | 290 | 52.9 | 9 |
Denver – Chicago O’Hare | DEN–ORD | 9.39% | 2.84% | 1.02% | 9 | 9 | 159 | 52.5 | 10 |
New York JFK – Los Angeles | JFK–LAX | 7.99% | 2.12% | 4.49% | 8 | 3 | 357 | 52.2 | 11 |
Newark – Orlando | EWR–MCO | 7.63% | 1.45% | 4.36% | 8 | 7 | 172 | 49.1 | 12 |
Chicago O’Hare – Houston Intercontinental | ORD–IAH | 9.74% | 1.16% | 2.09% | 9 | 7 | 179 | 46.1 | 13 |
Charlotte – Orlando | CLT–MCO | 10.16% | 1.45% | 3.85% | 6 | 7 | 110 | 45.7 | 14 |
Denver – Phoenix | DEN–PHX | 4.93% | 4.93% | 0.68% | 9 | 3 | 111 | 45.2 | 15 |
Los Angeles – Chicago O’Hare | LAX–ORD | 8.11% | 2.05% | 2.17% | 3 | 9 | 263 | 44.8 | 16 |
Chicago O’Hare – Phoenix | ORD–PHX | 11.56% | 1.46% | 1.88% | 9 | 3 | 230 | 44.3 | 17 |
Atlanta – Fort Lauderdale | ATL–FLL | 10.02% | 0.93% | 3.41% | 6 | 7 | 114 | 42.4 | 18 |
Chicago O’Hare – Orlando | ORD–MCO | 8.61% | 1.04% | 1.28% | 9 | 7 | 170 | 42.1 | 19 |
Atlanta – Orlando | ATL–MCO | 11.53% | 0.95% | 2.40% | 6 | 7 | 95 | 40.9 | 20 |
Denver – Orlando | DEN–MCO | 5.43% | 1.26% | 0.62% | 9 | 7 | 219 | 39.4 | 21 |
San Francisco – Denver | SFO–DEN | 5.24% | 0.27% | 0.66% | 8 | 9 | 161 | 34.9 | 22 |
Los Angeles – San Francisco | LAX–SFO | 6.42% | 0.32% | 1.74% | 3 | 8 | 95 | 28.1 | 23 |
Honolulu – Kahului | HNL–OGG | 0.42% | 0.17% | 1.82% | 2 | 4 | 40 | 12.0 | 24 |
Excluded: no operational data available | |||||||||
Las Vegas – Los Angeles | LAS–LAX | No data | No data | No data | 3 | 3 | 79 | – | – |
Houston Intercontinental – Denver | IAH–DEN | No data | No data | No data | 7 | 9 | 169 | – | – |
Houston Intercontinental – Los Angeles | IAH–LAX | No data | No data | No data | 7 | 3 | 237 | – | – |
San Francisco – Seattle | SFO–SEA | No data | No data | No data | 8 | 7 | 133 | – | – |
San Francisco – Las Vegas | SFO–LAS | No data | No data | No data | 8 | 3 | 103 | – | – |
Newark – San Francisco | EWR–SFO | No data | No data | No data | 8 | 8 | 374 | – | – |
Note: Data was unavailable for 6 of the busiest US domestic routes, so we excluded them from the study.
Analyzing the averages: The top 24 in numbers
For comparison, it’s useful to start with a baseline. Here are the 24-route averages for each category:
- 60+ minute delay rate: 9.34%
- 180+ minute delay rate: 1.8%
- Cancellations: 3.47%
- Flight time: 170 minutes
- Departure airport weather exposure: 7.125/10
- Destination airport weather exposure: 7.04/10
Top 3 most stressful US routes
To get a full picture of stressful routes, we need to look at multiple factors: frequent longer delays, disruptive cancellations, long flights, and risky weather all contribute to the flight experience. These are the 3 potentially worst domestic routes for nervous flyers in 2026:
#1 New York LaGuardia to Chicago O’Hare: highest score overall
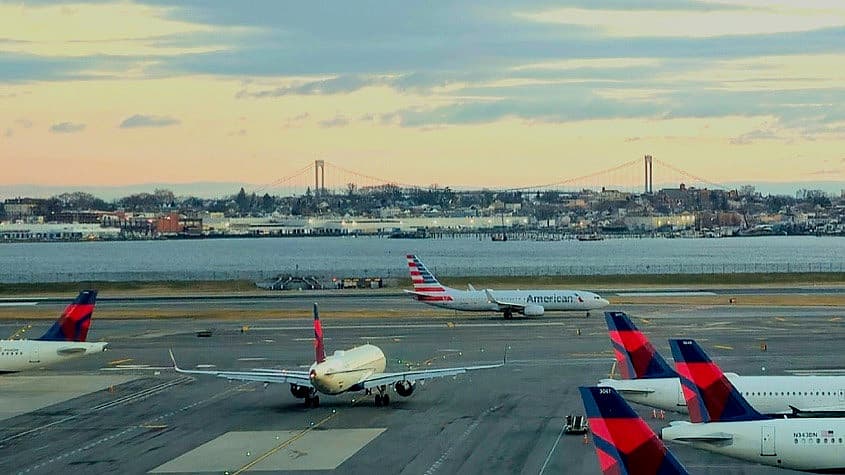
Final score: 75.8/100
Traveling from LaGuardia to O’Hare has the highest overall rate of cancellations (10.49%). This is well above the route average of 3.47%. Chicago O’Hare is a departure or arrival airport on five of the 10 highest-scoring routes on our list.
This, coupled with above-average scores for both 60+ and 180+ minute delays and high weather vulnerability scores, makes LGA to ORD the worst US route on the Nervous Flyer Index.
- 60+ minute delay rate: 11.32%
- 180+ minute delay rate: 2.48%
- Cancellations: 10.49%
- Flight time: 168 minutes
- New York LaGuardia Airport weather exposure: 8/10
- Chicago O’Hare Airport weather exposure: 9/10
#2 Orlando International to New York LaGuardia:
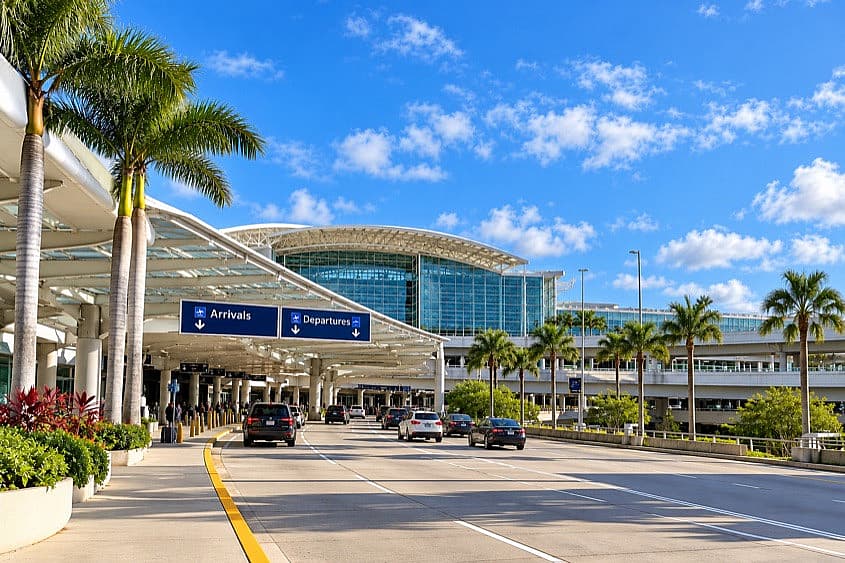
Final score: 71/100
The route from MCO to LGA places second overall for its consistently above-average cancellation and delay rates.
- 60+ minute delay rate: 12.84% (second-highest after DFW to MCO)
- 180+ minute delay rate: 2.06%
- Cancellations: 9.82%
- Flight time: 167 minutes
- Orlando International Airport weather exposure: 7/10
- New York LaGuardia Airport weather exposure: 8/10
#3 Boston Logan to Chicago O’Hare
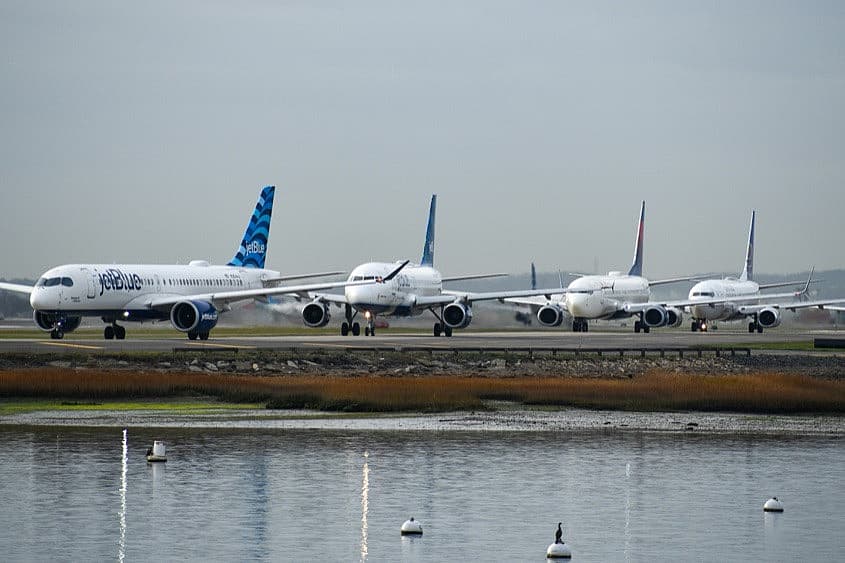
Final score: 65.8/100
BOS to ORD takes the third spot on our list of stressful routes. Although the cancellation rate is less than half that of the LaGuardia to O’Hare route, it’s still above average.
- 60+ minute delay rate: 12.71%
- 180+ minute delay rate: 2.71%
- Cancellations: 5.16%
- Flight time: 202 minutes
- Boston Logan Airport weather exposure: 8/10
- Chicago O’Hare Airport weather exposure: 9/10
Here’s how all the 24 domestic routes stack up for cancellation rates. LaGuardia to O’Hare is the worst (highest rate), and Denver to Orlando is the best (lowest rate):
The US routes most vulnerable to weather
Severe and changeable weather can quickly lead to stress. Will the flight depart on time, or will it be canceled? Will the takeoff and landing be rough? Let’s now look at the routes with the highest weather-related scores.
Denver to Chicago O’Hare has the highest total weather score
When we combine the departure and arrival weather scores for DEN to ORD, the total is 18. This is how the other routes stack up for total weather:
Worst-rated US airports in our 24 routes for weather
Two airports scored the highest (9) for weather vulnerability: Chicago O’Hare (ORD) and Denver (DEN). Chicago and Denver both deal with heavy winter snow and summer storms.
Methodology for the 2026 Nervous Flyer Score
Our original list included 30 of the USA’s busiest routes, where the volume from January 1, 2026, to August 31, 2026, was calculated using our flight database. For six of the 30 routes, some data were unavailable, bringing our index total to 24.
The six missing routes are: LAS–LAX, IAH–DEN, IAH–LAX, SFO–SEA, SFO–LAS, and EWR–SFO.
We scored each of the 24 routes from 0 to 100 using operational data for flight delays and cancellations from September 1, 2025, to August 31, 2026. The six categories are described and weighted as follows:
| Metric | What it measures | Why it can matter to nervous flyers | Weight |
Cancellations | Canceled flights out of total flights (%) | Cancellations can create uncertainty and the stress that goes along with rebooking flights and adjusting travel plans. | 25% |
180-minute+ delays | Flights delayed by at least 180 minutes out of total flights (%) | The longer the wait, the more likely it is to disrupt travel plans and lead to missed connections and unexpected overnight stays. | 20% |
60-minute+ delays | Flights delayed by at least 60 minutes out of total flights (%) | Waiting at the airport for an hour or more contributes to a stressful journey. | 15% |
Departure weather | Departure airport weather vulnerability | Severe weather increases the chance of delays and cancellations disrupting your travel. | 15% |
Destination weather | Arrival airport weather vulnerability | Bad weather at the destination can lead to rerouting, where passengers end up at an entirely different airport, or cancellations. | 15% |
Flight time | The average flight duration | When flights are longer, nervous flyers have to spend more time in the air, which is stressful. | 10% |

A high score doesn’t mean a route is unsafe. It means passengers are more likely to encounter the things that make flying stressful, such as delays, cancellations, difficult weather, and simply spending longer in the air.
- Anton Radchenko, CEO at AirAdvisor.
Ways to make flying feel less stressful

Take every step to minimize the stress on your end. There are things you can do both before and during the flight to help you feel more at ease.
Before the flight
- Always choose direct flights if you can. Avoid tight connections and standby flights due to the uncertainty.
- Fly early. Often, this leaves more options later in the day if your original flight is disrupted.
- Monitor your flight closely. When you know what’s coming, it’s easier to prepare for it and stay calm. It also helps to enable flight notifications from your airline app.
- Arrive early. Lines, baggage issues, and general airport congestion can all lead to stress. If you leave early, you’ll have the time you need to be patient and wait things out.
On the flight
- Fly with a friend or family member. They can help take your mind off things.
- Inform the cabin crew when you board if you’re an anxious flyer. They’ll often do their best to help.
- Bring distractions like music and books.
- Don’t forget that bad weather, delays, and cancellations happen often. It’s normal.
How to reduce your flight disruption exposure
The same things that reduce stress before you fly can simultaneously reduce the risk of a flight delay or cancellation:
- Early departures
- Reasonable flight connection times
- Direct flights
- Early airport arrival
Flight status monitoring helps, too. The sooner you know that your flight is disrupted, the better positioned you are to rebook, get a hotel, or switch airports before things fill up.
What you need to do when your flight is disrupted
- Ask in person at the airline’s desk for rebooking options or call/use the app to contact customer service.
- Review your available options and choose to either continue flying or get a refund, depending on the situation.
- Retain all documentation; you may need receipts (food, drinks, hotel, etc.), boarding passes, and airline communication/disruption proof to make a claim later on.
- Get the airline to confirm the reason for the delay or cancellation in writing if possible.
- Know your passenger rights. If an airline cancels your flight or significantly changes it and you choose not to accept the new one that’s offered, you may be entitled to a refund. For disruptions within an airline's control, you may also be entitled to rebooking or other interim assistance depending on the airline's policies.
Since not all flights or situations are eligible for care during a delay or compensation in the US, check your flight to see what you can claim now.




