
The Worst Airports in the USA for Canceled Flights: Hubs to Avoid for Disruption-Free Travel
See which 10 major US airports have the highest flight cancellation rates based on AirAdvisor AirData. Plan your travel to avoid delays and missed connections.


TL;DR
- The worst 10 US airports for flight cancellations have rates that range from as high as 5.2% to as low as 2.82%.
- New York’s LaGuardia Airport has the worst cancellation rate (the 5.2%), with nearly 3,000 canceled flights in 2025.
- Data includes cancellations from the 45 busiest US airports from January 1, 2025, to December 31, 2025.
- The ranking metric is the cancellation rate: total annual flights canceled divided by total annual flights.
- The highest number of cancellations occurs on short-haul flights (1,500 km/932 miles or less).
A flight cancellation is just about the quickest way to derail your travel plans. You have to find a new flight or completely change your itinerary. Either way, the disruption is big.
To help passengers minimize the chances of flight cancellations, we’ve created a list of the top 10 worst US airports for canceled flights. Then, you can potentially adjust your route and look for alternative airports close by or, at the very least, be more prepared for an eventual cancellation.
Methodology
Using our AirAdvisor AirData from January 1, 2025, to December 31, 2025, we reviewed the cancellation rate at the 45 US airports with the highest cancellation numbers. We used the rate to ensure that airports with high flight volumes weren’t unfairly penalized.
In real terms, the lower the flight cancellation rate, the better it is for passengers. We then ranked the 10 worst airports in descending order.
- Annual cancellation rate = Total canceled annual flights divided by the total flights from the airport per year.
We also reviewed the flight distances of each canceled flight to determine when cancellations are more likely to happen. This is split between:
- Flights under 1,500km (932 miles) – short-haul, usually domestic.
- Flights between 1,500km and 3,500km (2,175 miles) – medium-haul, domestic and international.
- Flights over 3,500km – long-haul, usually international.
Key Findings
- LaGuardia in New York is the riskiest US airport to use if you’re trying to avoid flight cancellations. In 2025, they canceled 5.2% of all flights.
- On average, the cancellation rate of the 45 airports in our study is 2.34%. So, more than 2 out of every 100 flights are canceled.
- Atlanta’s Hartsfield-Jackson Airport has the highest number of total flights, but a cancellation rate of 1.63%, which is well below the average.
- Chicago O’Hare Airport had the highest number of individual flights canceled – 11,442; it’s also #2 on our list of the US airports with the most 60+ minute delays.
- New York JFK cancels the most long-haul flights (2,019). That’s nearly two times more than the next highest, LAX (1,100), when LAX does only one-third ess volume than JFK.
Ranking of the 10 Worst US Airports for Flight Cancellations
Rank | Airport | Cancel rate | Flights /year | Flights canceled |
1 | LA GUARDIA AIRPORT (LGA) | 5.2% | 57,661 | 2,998 |
2 | BUFFALO NIAGARA INTERNATIONAL AIRPORT (BUF) | 3.95% | 23,963 | 946 |
3 | RONALD REAGAN WASHINGTON NATIONAL AIRPORT (DCA) | 3.8% | 59,834 | 2,273 |
4 | NORFOLK INTERNATIONAL AIRPORT (KORF/ORF) | 3.52% | 19,815 | 697 |
5 | CLEVELAND HOPKINS INTERNATIONAL AIRPORT (CLE) | 3.18% | 35,900 | 1,141 |
6 | NEWARK LIBERTY INTERNATIONAL AIRPORT (EWR) | 3.09% | 170,193 | 5,266 |
7 | BOSTON LOGAN INTERNATIONAL AIRPORT (BOS) | 3.02% | 190,057 | 5,743 |
8 | CHICAGO O'HARE INTERNATIONAL AIRPORT (ORD) | 2.96% | 386,602 | 11,442 |
9 | DALLAS FORT WORTH INTERNATIONAL AIRPORT (DFW) | 2.91% | 345,614 | 10,072 |
10 | CINCINNATI NORTHERN KENTUCKY INTERNATIONAL AIRPORT (CVG) | 2.82% | 36,346 | 1,025 |
Top 3 Worst US Airports for Canceled Flights
Now, let’s dive a bit deeper into the AirAdvisor AirData for the three worst airports in the USA for flight cancellations:
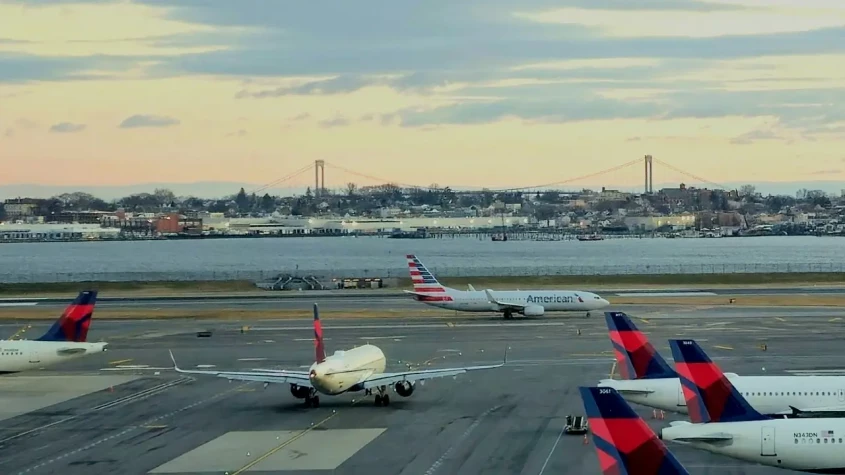
LaGuardia Airport (LGA) – New York
New Yorkers are lucky in that they have three major airports to choose from. The bad news is that LaGuardia is the worst option in the country, Newark Airport is also in the top 10 worst, and JFK only misses the top 10 by a hair – it has an above-average cancellation rate of 2.81%. Here’s what you’re getting into with LaGuardia:
- Although the airport’s volume is relatively low, with 57,661 annual flights, the cancellation rate of 5.2% is 1.25% higher than its closest rival for the worst cancellation airport title.
- While LaGuardia canceled 0% of flights over 3,500km, that’s not the good news it sounds like. The truth is, the airport doesn’t fly routes of this distance. 74% of cancellations were short-haul routes, and 26% were medium-haul ones.
- Any of the other New York area airports is a better travel option to minimize cancellation disruptions than LaGuardia.
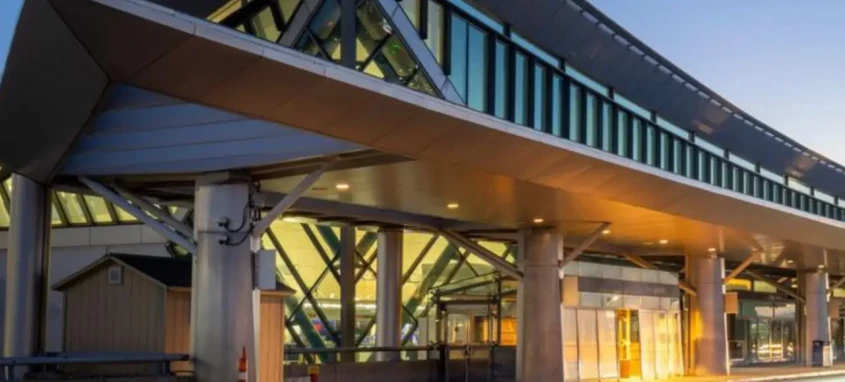
Buffalo Niagara International Airport (BUF) – New York
BUF is a lower-volume airport, but it still has one of the highest cancellation rates in the group:
Image source: buffaloairport.com
- Buffalo-Niagara Airport has a 3.95% cancellation rate, which is 1.61% above the 45-airport average of 2.34%.
- As you might expect from an airport of this size, it mostly flies short-haul flights, so the flight cancellations are most common in this route category.
- If you can avoid BUF airport, it might be a good idea. Consider alternatives like Rochester or Hamilton (across the Canadian border) if the route you need is offered.
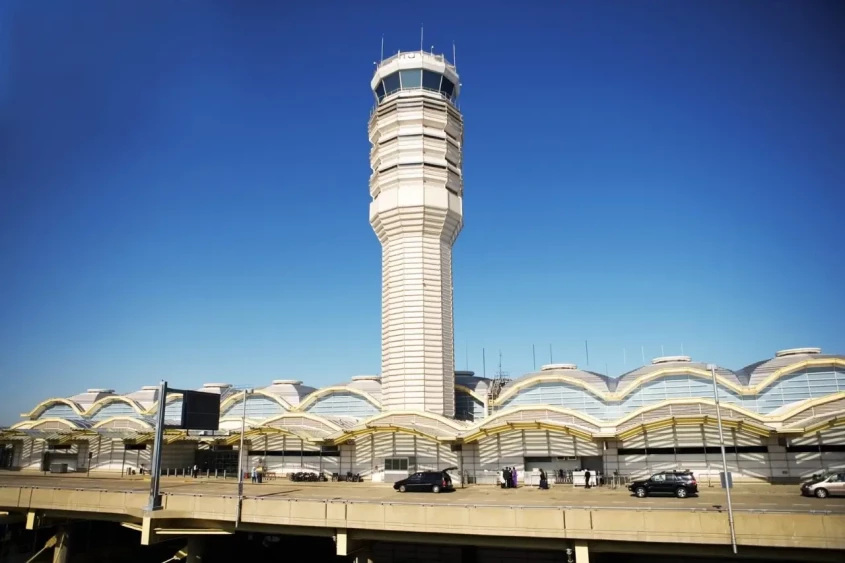
Ronald Reagan Washington National Airport (DCA) – Virginia
Rounding out the top three is Ronald Reagan Washington National Airport, which serves the DC area, even though it’s located in Virginia.
- DCA’s flight cancellation rate for 2025 was 3.8%, only marginally better than Buffalo-Niagara.
- This airport cancels up to 2,273 flights annually, 92% of which are short-haul domestic routes.
- Instead of using Ronald Reagan Washington Airport, travel 30 miles to Dulles. The cancellation rate there is a much lower 1.73%, and it serves many of the same domestic routes.
What to Do If You’re Considering Flying Through These Airports
Let’s be clear – just because an airport has a high (or the highest) cancellation rate, doesn’t mean your flight will be canceled. But it does mean that it’s good to be prepared for the possibility.
- Build in flexibility – Aim for earlier flights when aircraft and crews are more likely to be in position, and delays haven’t yet cascaded through the system. Too many delays can easily turn into cancellations or missed connections.
- Keep an eye on the weather – Around the day of your flight, monitor weather conditions closely. For example, places like New York are more prone to cancellations due to snow and ice than airports in warmer areas of the country.
- The cheapest flight isn’t always best – To save money, you may be tempted to book the cheapest option, but if that flight has a connection through one of these higher-cancellation airports, the risk might not be worth it.
- Be prepared – If you’re booked to fly through any of the 10 worst US airports for canceled flights, keep anything essential for an overnight delay with you. Bring activities to pass the time, and have a plan for backup transportation and accommodation just in case.
It’s really all about awareness. Now that you know which airports have the most trouble with cancellations, you can plan accordingly. Then, a total headache can be downgraded to just a minor inconvenience.
Disrupted flight? You might have a right to compensation - up to $650.Check Your Flight
Data Use Rights
AirAdvisor publishes AirData insights based on aggregated flight performance data analyzed for consumer information purposes. Journalists, researchers, and industry professionals are welcome to reference these findings with attribution. Please cite the source as: “Data source: AirAdvisor AirData” and include a link to the original page where the data appears. The full dataset is available upon request.
For media inquiries, data clarifications, or reuse permissions beyond citation, please contact press@airadvisor.com.
FAQs
Does weather alone explain high cancellation rates?
You’ll notice that our top three worst US airports for cancellations are all susceptible to snowy conditions, but while weather can be a factor, it’s not the only one. Cancellation-prone airports often also struggle with managing flight operations. They may not have enough runways or gates to accommodate everyone, resulting in cuts.
Which flights are most likely to be canceled?
Late-day flights, regional connections, and flights with tight aircraft turnarounds are typically at higher risk of cancellations. Once delays begin, later departures are more likely to be canceled due to competing aircraft commitments or crews that are over their allowable hours.
What should I do if my flight is canceled at one of these airports?
Act quickly. Rebook as soon as possible, check alternative airports or routes, and review airline rebooking/compensation policies. Plus, you might be entitled to flight cancellation compensation if your flight involves a UK or EU airline and arrives in either of these areas.
Press Highlights
- Up to 5.2% of annual flights are canceled at the USA’s worst cancellation airport – LaGuardia.
- The majority of cancellations occur on domestic, short-haul flights.
- On average, US airports cancel flights at a rate of 2.34%.
To determine which US airports are the worst cancellation offenders, we compiled the canceled flight rate of 45 of the highest-volume airports in the country. We divided the annual canceled flights by the total annual flights from the airport. We also reviewed the distances of each cancellation. The complete data set is available upon request.
Source: AirAdvisor AirData analysis of 106,414 canceled flights from January 1 to December 31, 2025, measuring cancellation rates.

Author:
Amy LancelotteJob/Position: Senior Writer & Content Creator
Amy Lancelotte is a Senior Content Writer and editorial contributor at AirAdvisor with more than seven years of experience producing research-driven articles for global audiences. Her work focuses on travel, aviation, and air passenger rights, with an emphasis on factual accuracy, verified data, and clear, reader-first explanations.





