
The most cancellation-prone US flight routes 2026
Explore the 10 most canceled US flight routes. Compare real cancellation rates and find out which domestic and international routes to avoid in 2026.
TL;DR
- The most canceled route in the USA is from Boston Logan International Airport to Newark Liberty International Airport.
- The worst international route for flight cancellations is London Heathrow to Chicago O’Hare.
- The majority of the frequently canceled US routes are domestic.
- New York area airports (JFK, LaGuardia, and Newark) are the most common in the 10 worst routes for cancellations.
- The list is compiled using AirData from January 1 to December 31, 2025.
- We calculated the cancellation rate as a percentage of total flights, not the raw number of flights canceled.
Virtually nothing ruins your travel plans more than a flight cancellation. In 2025, the 50 US routes with the most cancellations were canceled 15,931 times. Even if we assume conservatively that each flight accommodates 100 passengers, that’s over 1.5 million people annually who need to make immediate travel plan changes.
Here’s AirAdvisor’s look at the 10 worst US routes for cancellations and tips for handling and preventing these annoying interruptions.
Methodology
Our main focus is the cancellation rate of each route to or from the US. Looking at all applicable routes from January 1, 2025, to December 31, 2025, we isolated the 50 airports with the worst canceled flight rates. From there, the 10 worst US routes in 2025 emerged.
The annual cancellation rate is expressed as a percentage: the number of times the route was canceled in one year out of the total annual operations of that same route. Instead of using the raw volume of cancelled routes, this gives us a more targeted look and doesn’t penalize large airports with high flight numbers.
We also reviewed the routes for distance and country to determine any correlations. For example, are long-haul flights more commonly canceled? What about domestic routes?
Since we want to avoid flight cancellations whenever possible, the higher the route cancellation rate, the worse it scores. So number 1 on our list is the worst route overall.
Key findings
- Flights from Boston Logan (BOS) to Newark (EWR) are the most canceled (7.15%).
- All 10 of the worst US routes involve a New York area airport.
- The only international airport that appears in the top 10 worst US routes is Toronto Pearson (YYZ).
- The highest volume route in the worst 10 is from Boston Logan to New York JFK.
- Cancellations occur the most frequently on domestic routes under 1,500km (932 miles).
Ranking of the 10 worst US routes for canceled flights
Rank | Route | Total flights | Flights canceled | Canceled flights % |
1 | Boston Logan International Airport (BOS) to Newark Liberty International Airport (EWR) | 3621 | 259 | 7.15% |
2 | Boston Logan International Airport (BOS) to LaGuardia Airport (LGA) | 4732 | 315 | 6.66% |
3 | John F. Kennedy International Airport (JFK) to Buffalo Niagara International Airport (BUF) | 6696 | 439 | 6.56% |
4 | John F. Kennedy International Airport (JFK) to Ronald Reagan Washington National Airport (DCA) | 6136 | 402 | 6.55% |
5 | LaGuardia Airport (LGA) to Toronto Pearson International Airport (YYZ) | 4523 | 296 | 6.54% |
6 | Toronto Pearson International Airport (YYZ) to LaGuardia Airport (LGA) | 4340 | 271 | 6.24% |
7 | Newark Liberty International Airport (EWR) to Boston Logan International Airport (BOS) | 3839 | 238 | 6.20% |
8 | LaGuardia Airport (LGA) to O’Hare International Airport (ORD) | 4286 | 265 | 6.18% |
9 | Norfolk International Airport (ORF) to John F. Kennedy International Airport (JFK) | 4188 | 249 | 5.95% |
10 | John F. Kennedy International Airport (JFK) to Toronto Pearson International Airport (YYZ) | 4281 | 252 | 5.89% |
Ranking the 5 worst routes over 1,500km for canceled flights
Rank | Route | Total flights | Flights canceled | Canceled flights % |
1 | John F. Kennedy International Airport (JFK) to Fort Lauderdale-Hollywood International Airport (FLL) | 8544 | 314 | 3.68% |
2 | Fort Lauderdale-Hollywood International Airport (FLL) to John F. Kennedy International Airport (JFK) | 10807 | 395 | 3.66% |
3 | John F. Kennedy International Airport (JFK) to Orlando International Airport (MCO) | 8106 | 255 | 3.15% |
4 | Orlando International Airport (MCO) to John F. Kennedy International Airport (JFK) | 10473 | 282 | 2.69% |
5 | London Heathrow Airport (LHR) to O’Hare International Airport (ORD) | 13222 | 308 | 2.33% |
Top 3 worst US routes for canceled flights
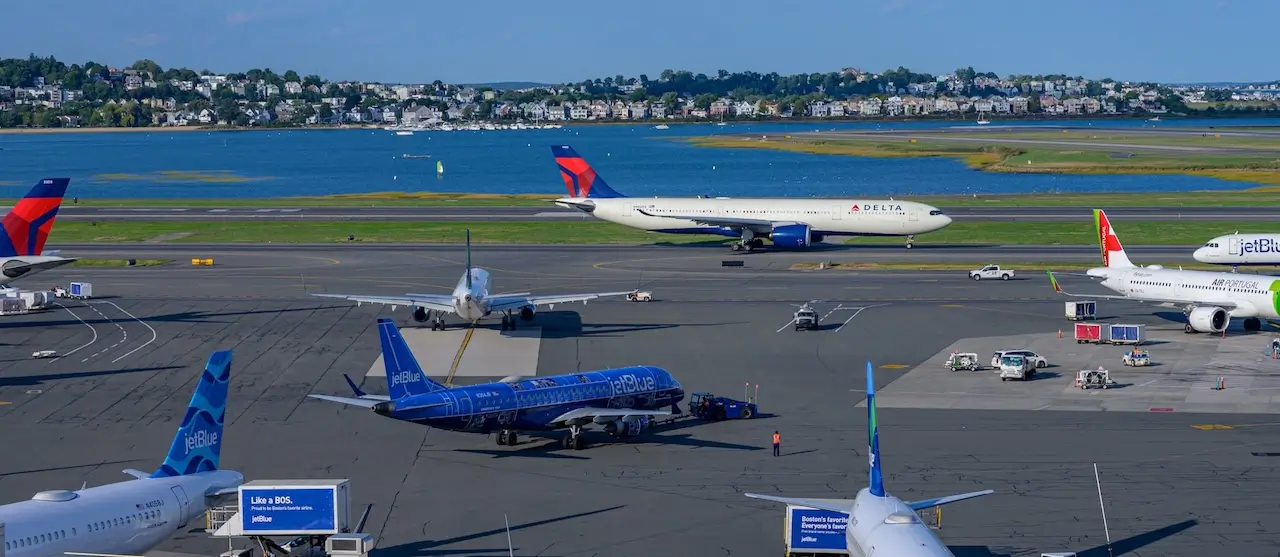
#1 BOS to EWR (Boston to Newark)
With 259 total annual cancellations in 2025 and a canceled rate of 7.15%, the most commonly canceled route in the USA is the one from Boston Logan to Newark Liberty.
- Other routes from Boston with significant cancellations include JFK (4.97%), LaGuardia (6.66%), and Ronald Reagan Washington (3.73%).
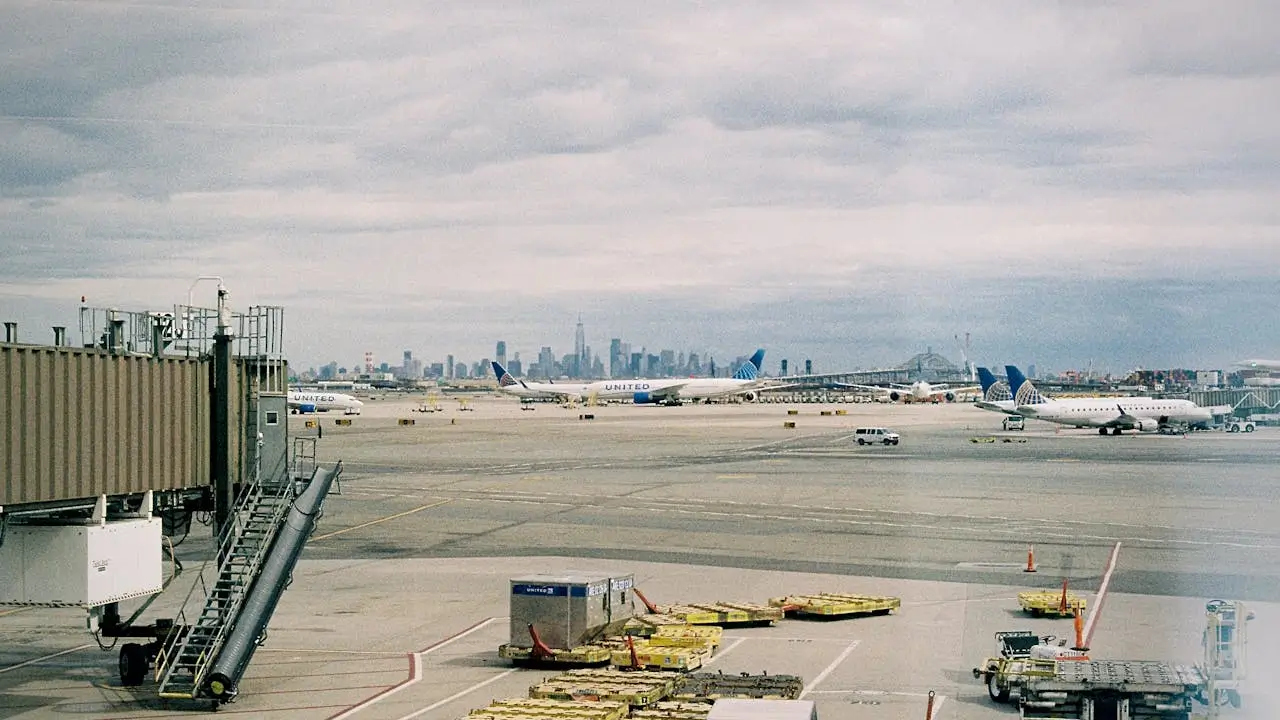
- The reverse route from Newark to Boston is also frequently canceled (6.20%)
- Since all of the NYC area destinations from Boston involve a high risk of cancellation, make sure you’re prepared. Don’t book tight connecting flights or schedule activities too close to your arrival.
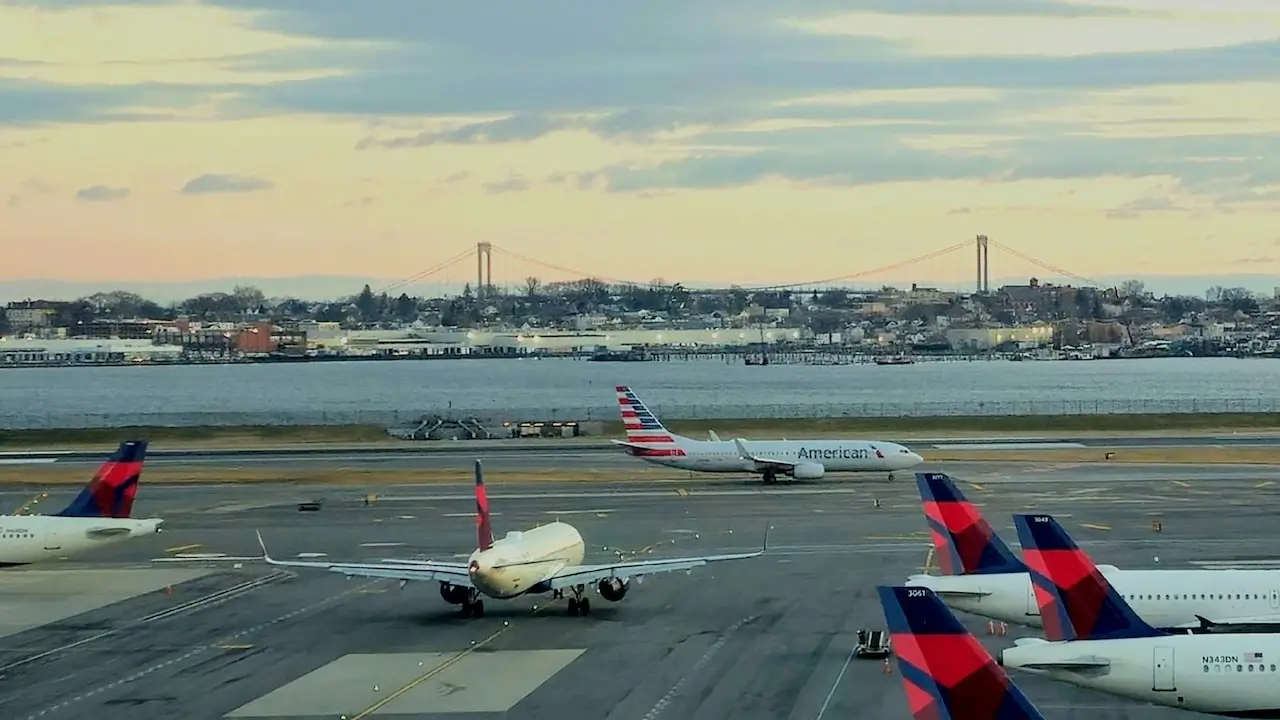
#2 BOS to LGA (Boston to New York)
As mentioned, the route from Boston Logan to LaGuardia has a high cancellation rate – 6.66%. In total, 315 flights on this route were canceled in 2025.
- When Laguardia routes are canceled, it’s usually both ways as these cancellation rates show: LGA to YYZ = 6.54%; YYZ to LGA = 6.24%, LGA to ORD = 6.18%, ORD to LGA = 5.88%; LGA to BOS = 4.75%.
- Of the 50 routes reviewed, BOS to LGA’s cancellation rate is more than 4 times higher than the lowest rate (1.58% for JFK to Heathrow).
- If you're flying this route or the return, keep an eye on the flight status. The sooner you know about the cancellation, the sooner you can take steps to get on another flight.
#3 JFK to BUF (New York to Buffalo)
You may already be noticing a trend. New York area routes are some of the most canceled in the country. The third-worst US route for cancellation is entirely within New York state, from JFK to Buffalo Niagara.
- This route is canceled 6.56% of the time, only marginally lower than BOS to LGA.
- The reverse of this flight is also commonly canceled. The cancellation rate from BUF to JFK is 4.76% (394 flights out of 8,275).
- While it takes 6 hours, it might make more sense to drive to Buffalo than risk a cancellation. You can also use LaGuardia with Delta and Newark with United to get to Buffalo Niagara International Airport.
How to use the AirData rankings when booking your next flight
While you can’t prevent a cancellation from happening in the first place, you can be prepared using these tips:
Avoid the last flights of the day
A lot can happen over the course of the day, so these late routes are more prone to cancellations. It’s more common for planes not to make it in time, or for staff to be past their allowable hours.
- Book morning flights whenever possible.
- Make sure there are flight alternatives after your chosen flight. That way, if something happens, you have options to continue the trip without being delayed overnight.
Fly direct
To avoid the cascading effect of a cancellation on connecting flights, if you have the choice, always book a direct flight. It removes at least one level of complexity.
Choose airports strategically
Some cancellations are driven by congestion and operational pressure, specifically in the New York area.
Even a slightly longer journey can be more reliable. For example, Philadelphia International Airport is only about 120 miles from New York City. Take the train or drive to PHL instead of risking a frequently canceled flight.
Leave plenty of time
Always avoid tight event and connection timelines, as cancellations can delay you by hours or even days. Consider planning to arrive the night before to alleviate some of the stress.
What to do if your flight is canceled
- Don’t panic.
- Act quickly to find flight alternatives
- If no alternatives are available the same day, book accommodation before it fills up.
- Keep receipts and documents to prepare for a potential flight cancellation claim.
Data use rights
At AirAdvisor, we publish AirData insights based on our database of performance data. It’s analyzed for consumer information purposes only. Journalists, researchers, and industry professionals are welcome to reference these findings with attribution. Please cite the source as: “Data source: AirAdvisor AirData” and include a link to the original page where the data appears. The full dataset is available upon request.
For media inquiries, data clarifications, or reuse permissions beyond citation, please contact press@airadvisor.com.
FAQs
Why do some US flight routes get canceled more often than others?
Certain US flight routes experience more cancellations due to factors like weather patterns, air traffic congestion, airline scheduling, and limited runway capacity. Hub-to-hub routes are especially vulnerable; delays or issues at one airport can quickly lead to cancellations across the network.
Which airlines cancel flights the most in the US?
According to our 2025 airline AirData, JetBlue Airways has the highest percentage of canceled flights at 4.92%, followed by Delta at 3.61%.
Which US airports have the highest cancellation rates?
In 2025, New York’s Laguardia Airport (LGA) had the highest cancellation rate, 5.2%. A total of 2,998 flights were canceled.
Press highlights
- Up to 7.15% of individual routes in the USA are canceled each year.
- Most cancellations are linked to the NY area and occur on domestic routes.
- On average, the 50 worst routes for cancellations in the US are canceled 4.42% of the time.
To find the worst US routes for cancellations, we reviewed the 50 routes with the highest rates of canceled flights. This is the total annual route cancellations divided by the total annual flights of the same route. We also examined the correlation of domestic vs. international flights and flight distance. The complete data set is available upon request.
Source: AirAdvisor AirData analysis of 15,931 canceled flights from January 1 to December 31, 2025, measuring cancellation rates.

Author:
Amy Lancelotte
Job/Position: Senior Writer & Content Creator
Amy Lancelotte is a Senior Content Writer and editorial contributor at AirAdvisor with more than seven years of experience producing research-driven articles for global audiences. Her work focuses on travel, aviation, and air passenger rights, with an emphasis on factual accuracy, verified data, and clear, reader-first explanations.

