
10 least punctual US airports for 2025 - America’s worst hubs for delays
Discover the 10 least punctual airports in the US. See where delays are problematic, why they happen, and how to plan smarter for stress-free travel in 2025.
No one likes long delays. In fact, they can quickly have a cascading effect on connecting flights and your travel plans. Your itinerary suffers, and you’re stuck waiting at an airport when you could be doing something much more productive (like sleeping in).
Significant airport delays elevate stress levels, cause missed connections, and add costs to already tight travel budgets. If you have the opportunity to increase your chances of avoiding these headaches in 2025 and beyond, would you take it?
We think so. That’s why we’ve compiled a list of the 10 least punctual major airports in the US. Our goal was to identify the airports with the highest chances of long delays. We compiled and reviewed US Department of Transportation (DOT) data from this report for 30 of the country’s busiest hubs.
 The AirAdvisor Punctuality Rating is based on two criteria: the Chronic Delay Rate (CDF) and the long‑delay rate (LDA60), as indicated on the DOT list.
- CDF represents the share of an airport’s flight routes where more than half of arrivals are delayed by 30 minutes or more. (60% of the total score).
- LDA60 measures the percentage of flights departing after 5 p.m. from the airport that experience delays of at least 60 minutes. This is important because significant delays later in the day can lead to long nights waiting at the airport or flights delayed to the following day (40% of the total score).
The 10 least punctual US airports for 2025
First, let’s look at some overall numbers from the OAG monthly report on North American on-time flight performance for the major airports. In August 2025, the best on-time rate was 82.3%, meaning overall, only 17.7% of flights were delayed by more than 15 minutes.
Alternatively, the airport with the lowest on-time rate for the same period, Dallas Fort Worth International Airport, scored 65.65%, so more than one-third of flights had at least a 15-minute delay.
But we want to focus on delays of 30 and 60 minutes because this loss of time is much more disruptive. Let’s get to our list of the worst airports for long delays in the USA, starting with the “best” of the worst.
.webp)
Seattle-Tacoma International Airport (SEA)
As the largest airport in the Pacific Northwest, Sea-Tac sees its fair share of travelers. Unfortunately, these travelers experience longer flight delays more often.
Seattle-Tacoma Airport has a chronic delay rate of 59.04% and a long-delay rate (for flights after 5 p.m.) of 60.91%.
To be clear, we’re not saying that 59.04% of flights are delayed. We can’t say that because we’re not looking at every arrival from the airport. We’re saying that the baseline was 50% just to make the cut of the worst airports for long delays, and SEA is at 59.04%.
The good news is that the airport has lots to do because it’s not like they don’t know that flights are often delayed. There is a public art collection and the standard shopping and dining options to help you pass the significant delay time.
There are two main reasons why Sea-Tac flights are delayed: weather and gate access. During peak times, like the holidays, there aren’t enough gates to go around. Also, since the airport is in a valley and prone to fog, it’s common for flight delays and cancellations to happen.
Punctuality Score for SEA
- CDF - Share of routes with over half of arrivals delayed by 30 minutes+: – 59.04%
- LDA60 - Share of evening routes with 60+ min delays (after 5 p.m.) – 60.91%
- Weighted average – 59.79%
.webp)
Hartsfield-Jackson Atlanta International Airport (ATL)
If you think Sea-Tac is popular, compared to Hartsfield-Jackson in Atlanta, it’s not. In August 2025, ATL had 33,384 scheduled flights, whereas SEA had 20,012. Atlanta’s major airport is consistently the busiest in the world by passenger volume.
The 108 million passengers who used this airport in 2024 will likely tell stories of delays if asked. Hartsfield-Jackson’s LDA60 and CDF are virtually the same, but the bottom line is that flights here get significantly delayed.
The main cause of flight delays simply relates to volume. ATL is Delta’s largest hub in the country, and bottlenecks often happen because Air Traffic Control can’t keep up. Hartsfield-Jackson Airport is also a common transfer point for travelers, and the number of delays can’t help but impact tight connection schedules.
Punctuality Score for ATL
- CDF – 59.91%
- LDA60 – 59.95%
- Weighted average – 59.93%
.jpg)
Newark Liberty International Airport (EWR)
One of the three major New York areas was bound to show up on the list of the worst US airports for delays, right? That “honor” goes to Newark Liberty. And here’s a fun fact: EWR, open since 1928, is older than both JFK (1948) and LaGuardia (1939), making it the first major airport to serve the NYC Metropolitan Area.
Continuing the comparison, for passenger volume, EWR falls between the other two, and that means nearly 50 million people rely on this airport every year.
The bad news is that Newark Liberty is on our list of the USA’s least punctual airports. This air hub fared slightly better for chronic delays than longer ones after 5 p.m., but you can still bank on certain chronically delayed routes arriving late 60% of the time.
Now, why are Newark Airport flights delayed so often? A few factors. The airspace around it is constantly congested, which creates issues for Air Traffic Control. Just imagine having three major US airports so close together. Plus, the weather in the area is prone to snow, ice, fog, and thunderstorms, which can quickly ground planes.
Punctuality Score for EWR
- CDF – 59.83%
- LDA60 – 60.30%
- Weighted average – 60.02%
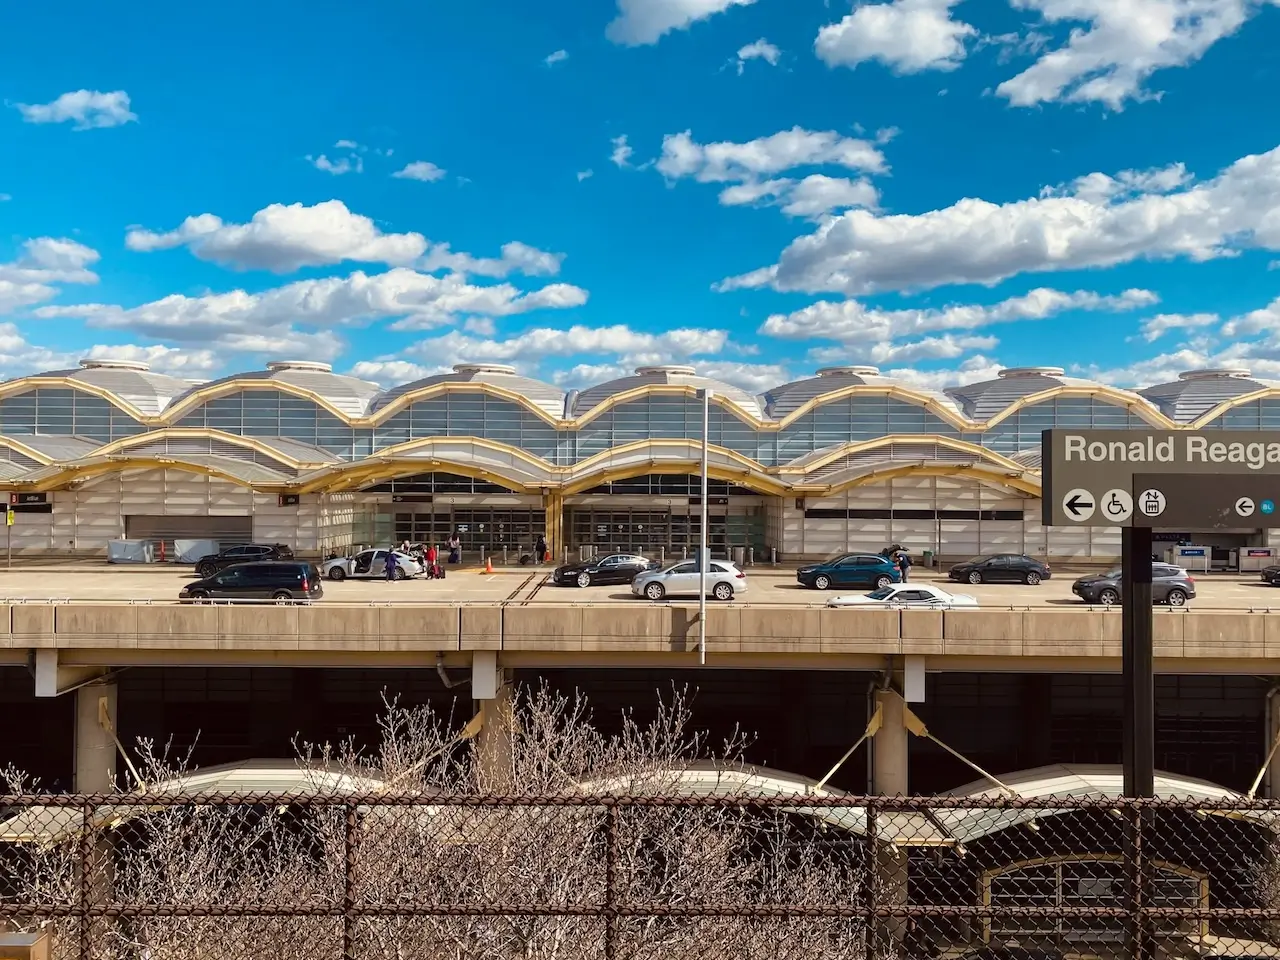
Ronald Reagan Washington National Airport (DCA)
Like with New York, the Washington, DC, area has three major airports: Ronald Reagan, Dulles, and Baltimore/Washington Thurgood Marshall. But unlike New York, two airports on this list serve the DC area (check out #4).
This national hub (the only one on the list that’s not an international airport) is also affected by airspace congestion and inclement weather. These and other factors, like runway and gate congestion, mean DCA has many flights delayed by a significant amount of time.
Similar to the airports we’ve discussed so far, Ronald Reagan Airport’s CDF and LDA60 are close, but that just means they’re consistent.
Interestingly, Ronald Reagan Washington National Airport adheres to something called the perimeter rule. This restricts flights landing at DCA to those originating within 1,250 miles or fewer, subject to a few previously granted government exceptions.
That makes DCA a short-haul airport, which means a higher frequency of flights. Gate and runway space are at a real premium for the 25 million passengers that fly here annually, and it’s easy to experience cascading delays.
Punctuality Score for DCA
- CDF – 59.99%
- LDA60 – 60.16%
- Weighted average – 60.058%
.webp)
Los Angeles International Airport (LAX)
We’re now midway through our list of America’s worst airports for delays in 2025, and we land at LAX. This West Coast giant is always in the conversation of the busiest airports in the US, with just over 38 million departing passengers (and the same for arrivals) in 2024.
Los Angeles is known for traffic, and that also applies to the city’s major international airport. Sometimes the drive to the airport and using the loop road that surrounds LAX can feel longer than the flight itself.
This hub is the gateway between the US and the Asia Pacific region, and with four parallel runways and a huge customs facility at the Tom Bradley International Terminal, the airport does its best to address the demand. Unfortunately, it falls short and is solidly among the USA’s least punctual airports.
Common delay reasons at LAX include weather and ground congestion. Los Angeles is prone to Santa Ana winds, which can prompt Air Traffic Control to reconfigure the runways, adding time to the procedures. All this traffic competes for gate space.
Punctuality Score for LAX
- CDF – 59.70%
- LDA60 – 60.61%
- Weighted average – 60.064%
.webp)
Minneapolis-Saint Paul International Airport (MSP)
Have you ever been delayed at an airport with its own mini-golf course? At Minneapolis-Saint Paul Airport, that’s reality, and you can stay entertained with a competitive round while you wait for your delayed flight.
MSP has a higher differential between CDF and LDA60 than we’ve seen so far. That translates to longer late-night delays and potential hotel stays for travelers.
Even with some of the most efficient snow-removal fleets in the world, this airport still delays and cancels flights due to severe weather in the Midwest. And it isn’t just the snow that can disrupt your plans. Minnesota gets tornadoes and thunderstorms that ground flights in the summer.
Punctuality Score for MSP
- CDF – 59.63%
- LDA60 – 61.07%
- Weighted average – 60.21%
#4 Baltimore/Washington International Airport (BWI)
We promised another DC area airport on this list, and now it’s time to deliver. Also known as Thurgood Marshall Airport, BWI is our first airport with a CDF and LDA60 over 60%.
This airport is the first in the country named after a Supreme Court Justice and serves three major metropolitan areas: DC, Baltimore, and Annapolis.
Most commonly, your flight delay here will be caused by congestion, both on the ground and in the air. BWI has the same challenges sharing airspace with the DC area airports and even Philadelphia’s international airport.
Punctuality Score for BWI
- CDF – 60.06%
- LDA60 – 60.62%
- Weighted average – 60.28%
Did You Know?
You may be eligible to claim reimbursement of out-of-pocket expenses under U.S. DOT regulations. For routes to or from Europe, you may qualify for statutory compensation of up to $700.Check Your Flight
.webp)
Tampa International Airport (TPA)
You know those people movers in lots of airports these days? The ones that help you cover the terminal ground faster? These were first tested and used at Tampa International Airport, so you have them to thank when your feet don’t hurt as much as they should.
But this efficiency in the movement of people doesn’t necessarily translate to flight timing. TPA is actually one of the three worst major airports in the country for significant delays.
We can’t talk about Florida without mentioning the weather, and Tampa has thunderstorms and hurricanes that will affect flights taking off and landing. Additionally, it’s common to experience significant delays during peak travel seasons, like the summer and Spring Break, as the airport tries to keep up with everyone’s demands for beach time.
Punctuality Score for TPA
- CDF – 60.67%
- LDA60 – 61.80%
- Weighted average – 61.12%
.webp)
San Francisco International Airport (SFO)
This is a good news, bad news situation. San Francisco International Airport is not the worst overall for long delays (that’s next), but it is the worst performer on our list for 60+ minute delays after 5 p.m. – 64.29%.
SFO accommodates over 51 million people annually, but unfortunately, significant delays are fairly common here. And if you’re at all familiar with the Bay Area, you’ll probably think of at least one reason why: fog.
This hub has two sets of parallel runways that are very close together. In perfect weather conditions, that’s not a problem. But when the fog sets in, San Francisco Airport can’t use all its runways because FAA rules require greater separation in low-visibility conditions. Fewer runways mean a big buildup of traffic.
Punctuality Score for SFO
- CDF – 60.07%
- LDA60 – 64.29%
- Weighted average – 61.76%
.webp)
Charlotte Douglas International Airport (CLT) – The Least Punctual US Airport
We’ve finally arrived at the US’s least punctual airport for long delays. Charlotte Douglas International Airport is here because it has the highest CDF of the bunch – 61.46%.
2024 was a record-breaking year for CLT. They welcomed 58.8 million passengers, but at what cost? This was an increase of more than five million (10%) compared to 2023. All this extra volume certainly contributes to the excessive delays.
To address this, the airport is constructing a new (fourth) runway, but that likely won’t be complete before 2027. So, passengers might have a while to wait to see any delay improvements. Weather is another factor, as the region sees plenty of thunderstorms.
Punctuality Score for CLT
- CDF – 61.46%
- LDA60 – 62.31%
- Weighted average – 61.80%
Tips to manage long airport delays
Since longer delays at these least punctual airports seem inevitable, you need to know how best to deal with them or try to avoid them altogether:
- Book flights earlier in the day. Avoid flights departing after 5 p.m. because a significant delay at this hour can mean disruptive hotel stays.
- Leave longer layovers when connecting at any of these airports. Two hours may not be enough.
- Monitor the weather at the departure and arrival airports. You can also use a flight tracking app to see where your plane is coming from and then assess the conditions there, too.
- Think about choosing an alternate airport. For example, instead of Newark Liberty, use JFK or LaGuardia.
Final data (May 2024 to May 2025)
Here is a summary of the gathered data. Note again that lower numbers are better, and the ranking #1 is for the worst airport overall.
2025 ranking | Airport (IATA) | Chronic‑delay rate (CDF) | Long‑delay rate (LDA60) | Weighted average (%) |
1 | CLT | 61.46% | 62.31% | 61.80% |
2 | SFO | 60.07% | 64.29% | 61.76% |
3 | TPA | 60.67% | 61.80% | 61.12% |
4 | BWI | 60.06% | 60.62% | 60.28% |
5 | MSP | 59.63% | 61.07% | 60.21% |
6 | LAX | 59.70% | 60.61% | 60.064% |
7 | DCA | 59.99% | 60.16% | 60.058% |
8 | EWR | 59.83% | 60.30% | 50.02% |
9 | ATL | 59.91% | 59.95% | 59.93% |
10 | SEA | 59.04% | 60.91% | 59.79% |
Our methodology
Our focus centered around the DOT’s List of Regularly Scheduled Flights with More Than 50% Delayed Arrivals of More Than 30 Minutes. Our 10 airports listed here are the worst out of 30 we reviewed for the time period between May 2024 and May 2025.
Our two priorities were chronically delayed flights (CDF) and the long-delay rate for flights departing after 5 p.m. (LDA60). More specifically, they are:
- CDF – The share of routes where more than 50% of arrivals are delayed by 30 minutes or more.
- LDA60 – This is the fraction of flights departing from an airport after 5 p.m. that arrived at least 60 minutes late compared to the total flights.
We assigned 60% of the value to CDF and 40% of the value to LDA60 to come up with the airport’s final weighted average.
Our values here deal only with long delays, not overall ones. To qualify, individual routes had to first make it onto the 50% delayed by 30 minutes+ list.
Navigating the challenges of America’s least punctual airports
When you have to use any of AirAdvisor’s 10 least punctual airports, just be prepared to wait longer than usual. Bring activities and snacks, and always keep your essential items with you.
And remember, it’s not that all flights departing from these 10 airports have a high chance of arriving late. It’s that they have more instances of significantly delayed flights than the other major US airports.
And if you want to remove some of the headache associated with significant flight interruptions from any airport, we can help. Learn your rights related to delays of three hours or more and flight cancellations. With AirAdvisor’s expertise, it may be possible to claim compensation.

Author:
Amy Lancelotte
Job/Position: Senior Writer & Content Creator
Amy Lancelotte is a Senior Content Writer and editorial contributor at AirAdvisor with more than seven years of experience producing research-driven articles for global audiences. Her work focuses on travel, aviation, and air passenger rights, with an emphasis on factual accuracy, verified data, and clear, reader-first explanations.

